Upload and highlight a list of elements#
- Click on “Add overlays” and fill in the form.
- Name (default)
- Description (free text)
- Provide list of elements (one per line)
- This list must contain the name of elements as it appears in the PD map (e.g., HGNC name for proteins and genes; CHEBI name for simple molecules)
- The list may contain names for different element types at the same time (see Fig. 13A)
- Click UPLOAD starts the process
- The new file will appear in USER-PROVIDED OVERLAYS.
- A short report will be send by mail (“MapViewer notification”).
- Data are visualized by green colour on the PD map after clicking the view box (Fig. 13B).
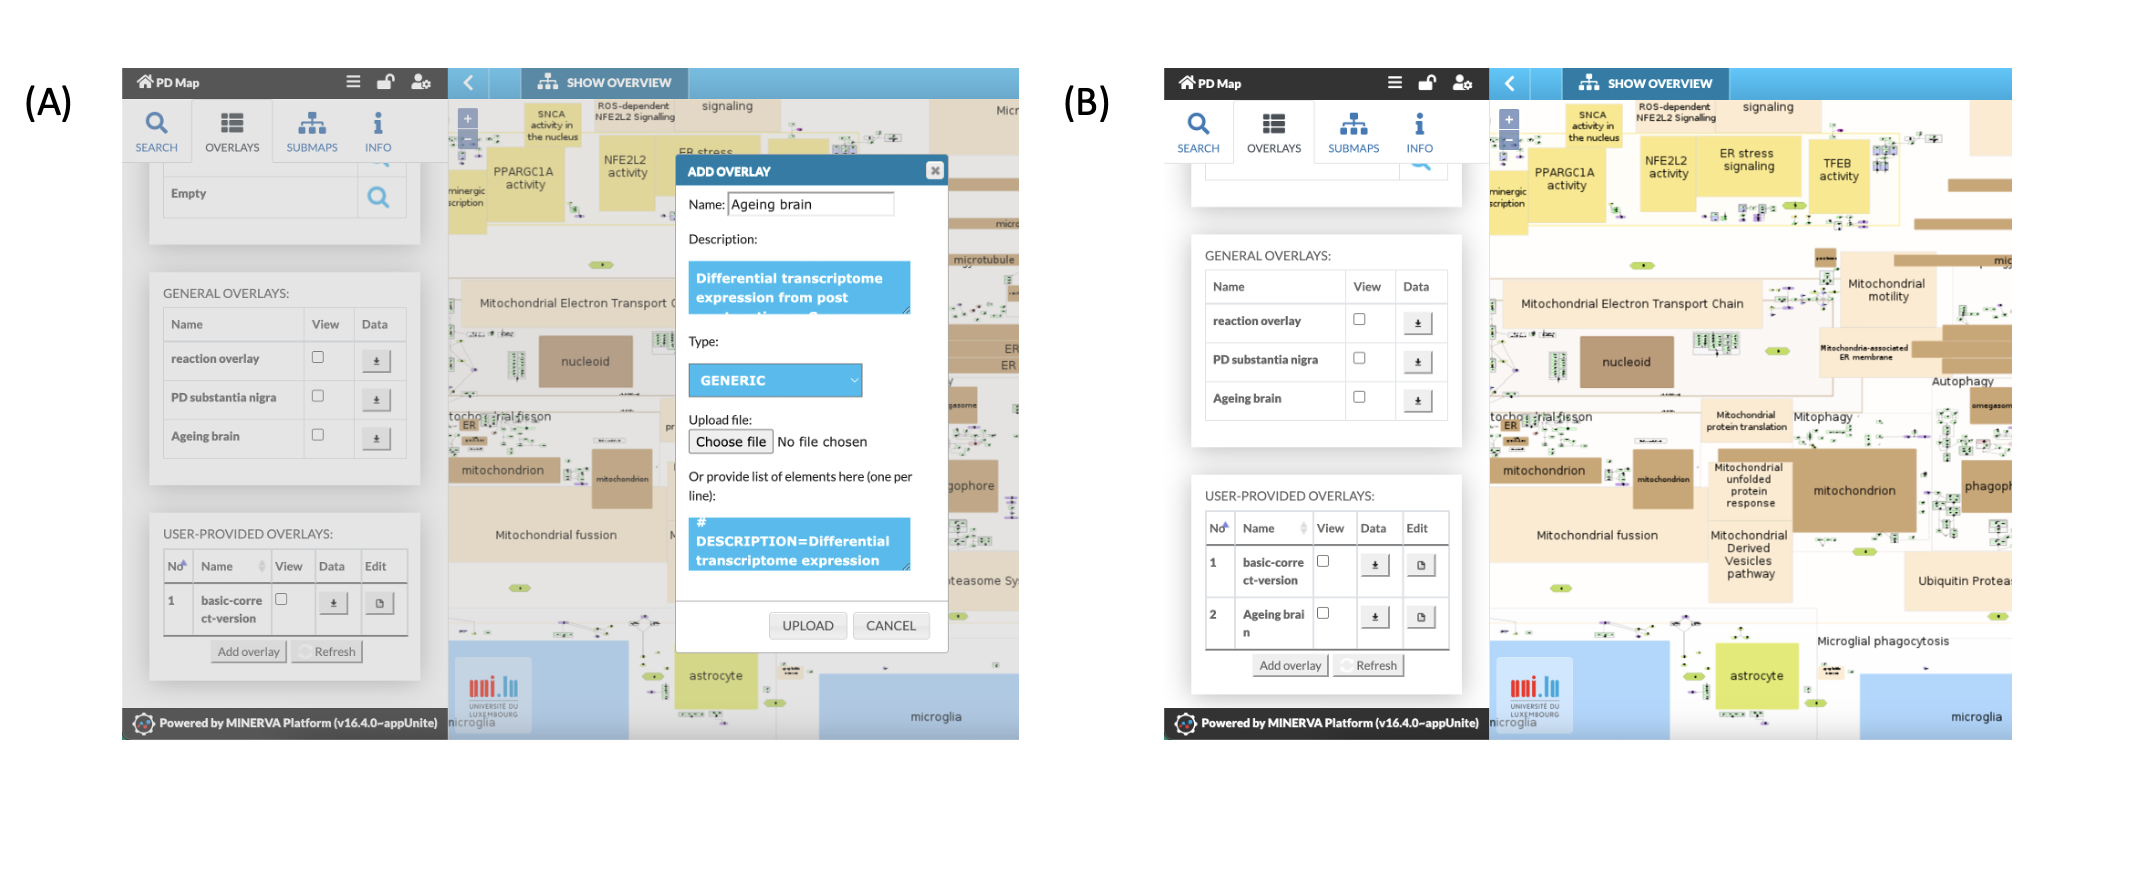
Fig. 13: Upload (A) a list of elements to the PD map and visualisation (B)
Upload of a data file: Data preparation
- Data file needs to be uploaded as a txt. file that consists of two columns
- first column (headline = name) contains HGNC gene symbols
- second column (headline = value) contains values between -1 and 1
- As both proteins and genes are defined in the PD map by the uniform HGNC identifier and HGNC gene symbol, data derived from protein or gene expression will be displayed on gene and protein species in the PD map.
- To upload data from other species than human, the species-specific identifiers need to be translated to HGNC identifiers.
- The differential expression values (fold changes) needs to be normalized into a range between -1 to 1 (see Fig. 14).
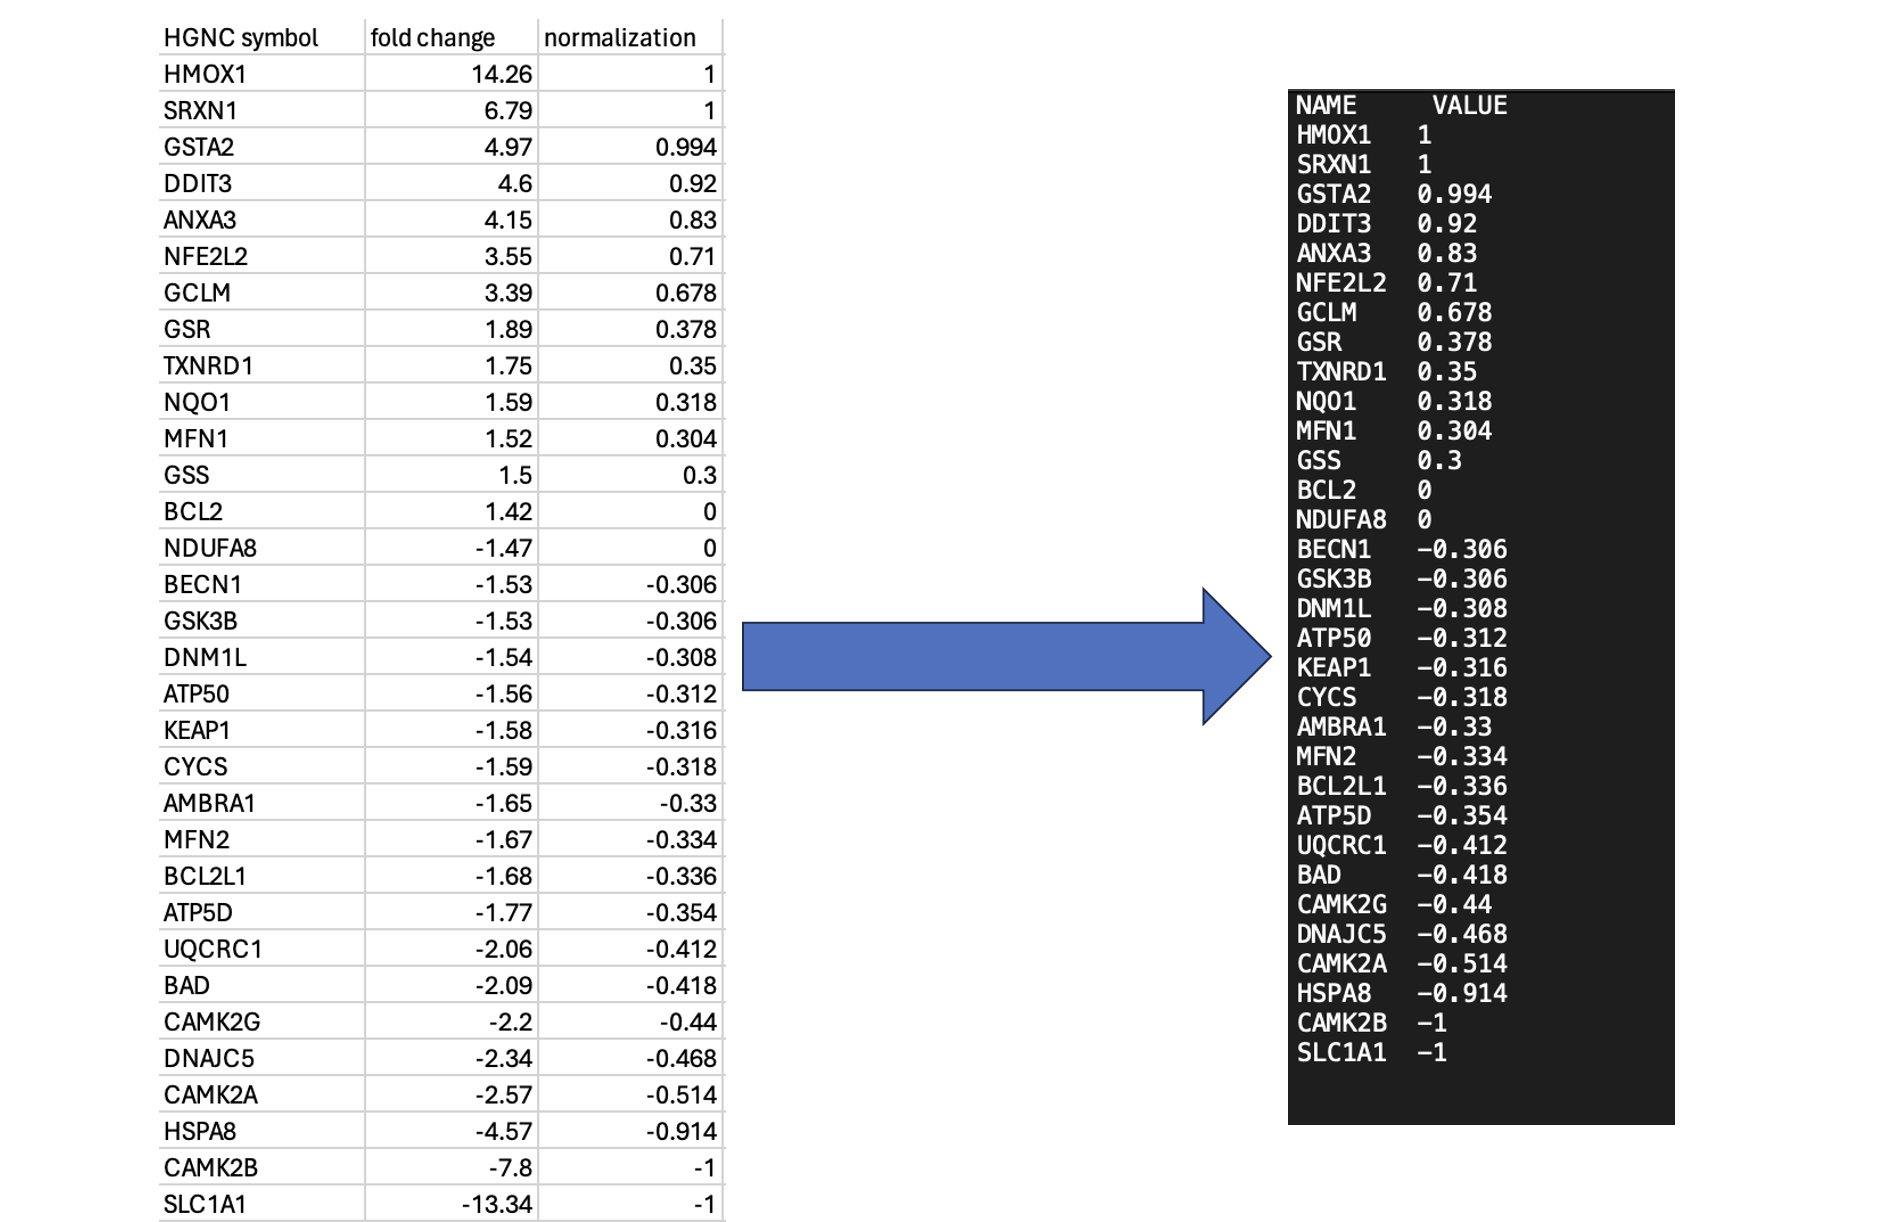
Fig. 14: Differential gene expression data (excel file) were edited and transformed into a txt. file before upload.Normalization applied here: fold change (f.c.) >5 is set 1; f.c. <-5 set -1; f.c. between -1.5 and 1.5 is set 0; f.c.between -5 and -1.5 as well as 1.5 and 5 are normalized by dividing the value by 5.
Upload of a data file: Data upload
- Click on the “OVERLAYS” tab. This opens the menu for data set upload and management (“USER-PROVIDED OVERLAYS”)
- Click on “Add overlays”
- Fill in form
- Name (default)
- Description (free text)
- Click on “Browse” an select the file to be uploaded
- Click “UPLOAD” to start the process
- The new file will appear in USER-PROVIDED OVERLAYS.
- A short report will be send by mail (“MapViewer notification”).
- Data could be visualized on the PD map by clicking on view. Color code: Blue for down regulation and Red for up regulation
- Elements are automatically coloured by the following colour codes in accordance to their dedicated values
Please note:
- Combining display of multiple data sets from “GENERAL OVERLAYS” and “USER-PROVIDED OVERLAYS” is possible by clicking different data sets under “View”. Results are displayed by subdivided coloured rectangles (see Fig. 11)
- In general, all PD map elements can be individually coloured on the PD map. If you like to colour elements individually contact us directly
- To upload data from other species (e.g., mouse), gene and protein names has to be translated to human HGNC identifier.
- All uploaded data are accessible by the system administrators due to technical reasons but they are not visible by any other user.