How to display implemented data sets#
- The visualization of specific data sets on differential gene regulation is accessible via the “OVERLAYS” tab (left panel). Different data sets are indicated under “GENERAL OVERLAYS”
- Ageing brain: Differentially expressed genes in healthy aging brain. Enrico Glaab (LCSB) contributed this data derived from Allen Brain Atlas database. red: stronger expression in aged brain; blue: lower expression in aged brain. See: Glaab and Schneider, 2015.
- PD substantia nigra: Differential gene expression (FDR <= 0.05) from the analysis of eight transcriptome data sets, comparing human post mortem brain samples from PD vs. healthy controls. red: stronger expression in PD; blue: lower expression in PD. See: Fujita et al., 2013.
- PD UK GO Project genes: Genes annotated by the Parkinson’s disease GO Annotation Project. dark green: high priority gene list, light green: Parkinson’s-relevant protein. See: Foulger e al., 2016.
- The expression data could be downloaded under “Data” (note: the value column in the downloaded list shows normalized expression values)
- Click boxes to display the respective data set on the PD map. Pathways and compartment view provides an overview on cellular processes affected by the visualized data (Fig. 10A)
- Detailed differential expression (red rectangle: up regulated, blue rectangle: down regulated) is best visible using the colourless overlay “Empty” (Fig. 10B)
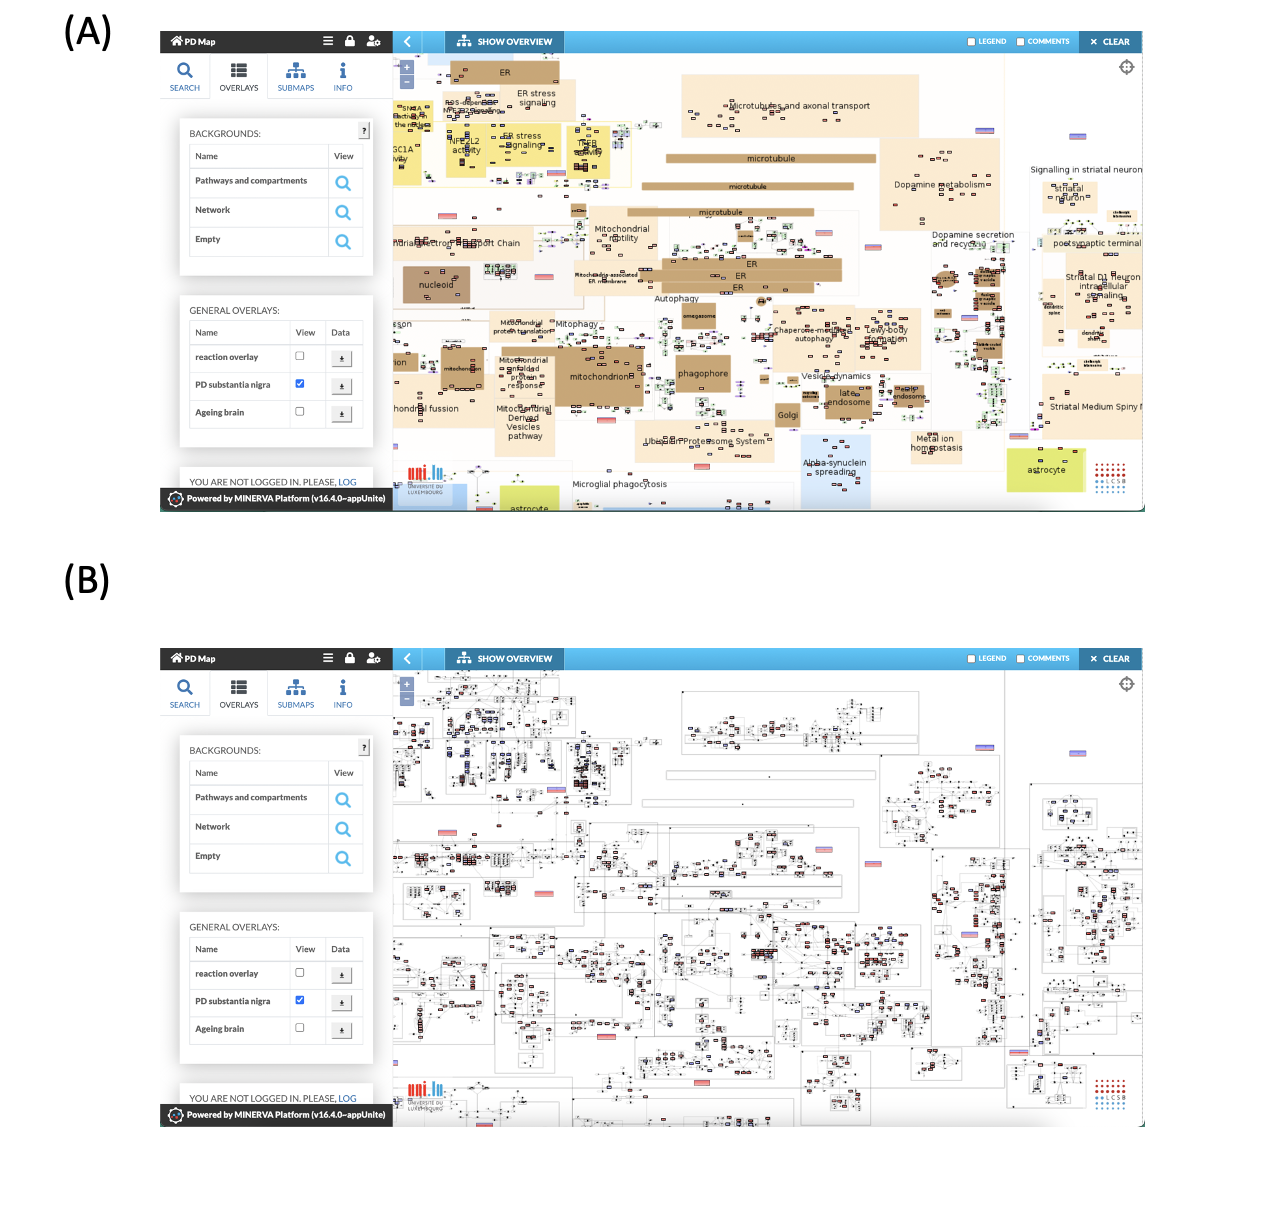
Fig. 10: Overlay of the PD substantia nigra data set to the PD map. (A) Pathways and compartment view. (B) Empty view
- Displaying multiple data set is possible by ticking several checkboxes in the “View” column. Results from different data sets are simultaneously displayed by subdivided coloured rectangles (Fig. 11)
- Additional information is provided when clicking on the species (Fig. 11)
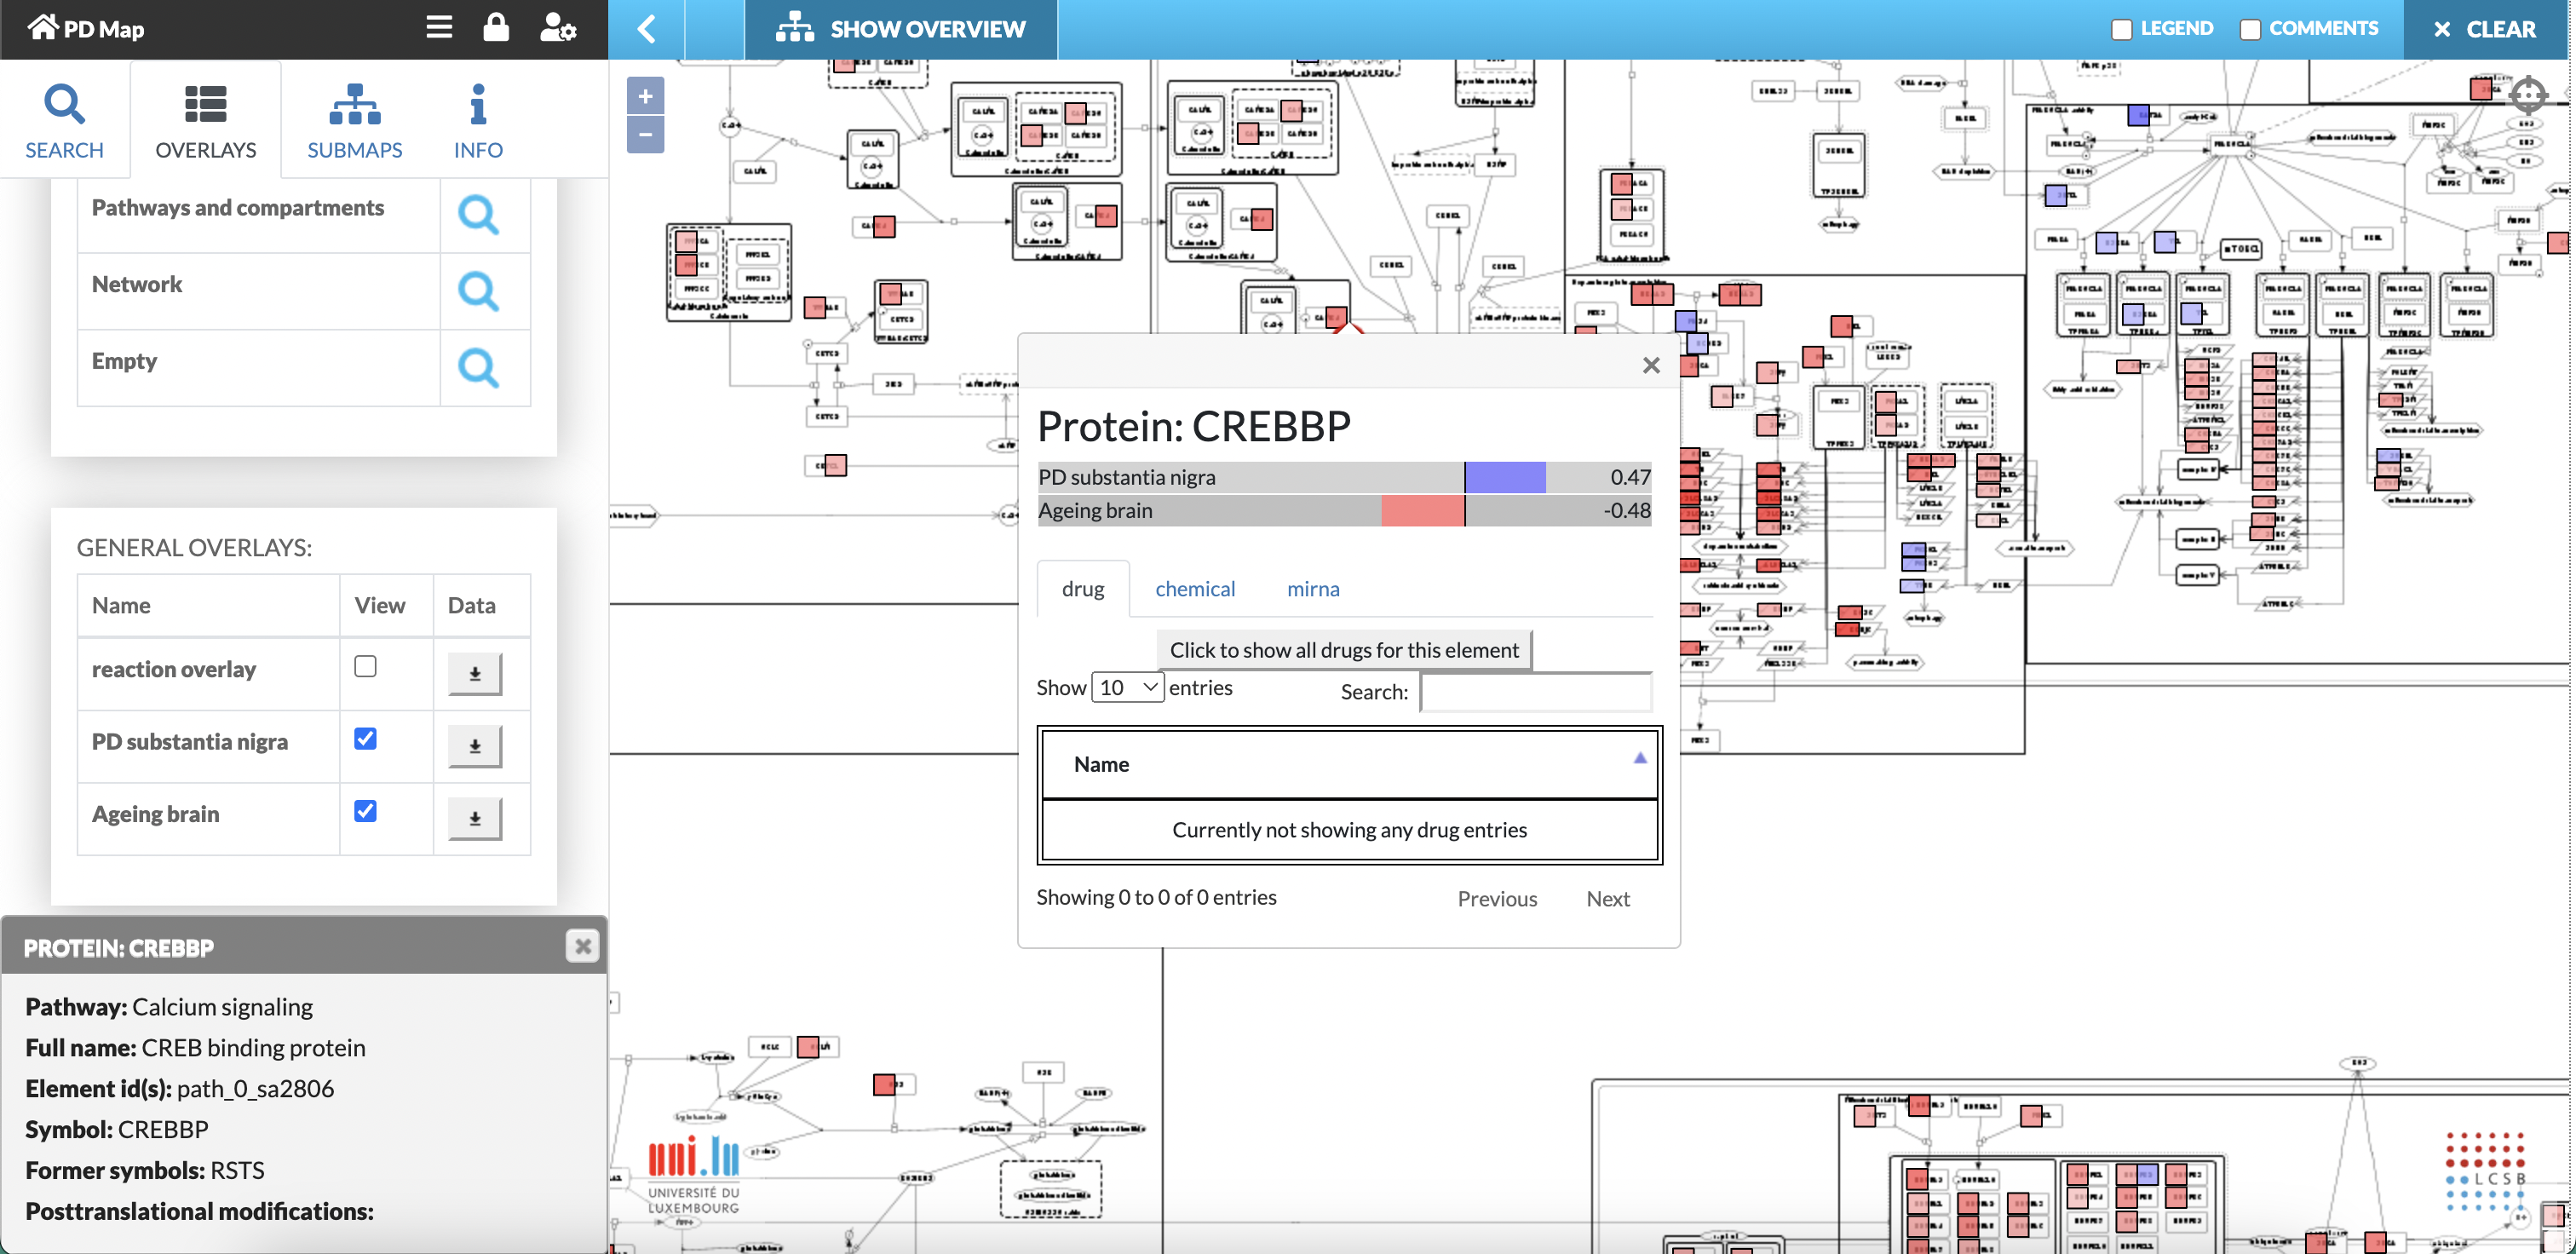
Fig. 11: Overlay of PD substantia nigra data set and ageing brain data set to the PD map. Clicking on CREBBP provided detailed information in a pop up box and on the bottom of the information panel. In addition, information on Interacting drugs, chemical or microRNA can be displayed (see Chapters: 4, 5, and 6)